
Big data isn’t just “lots of data.” It’s the ability to collect, connect, and analyze high-volume, fast-moving, and varied information so you can make better decisions—faster and with less guesswork.
For business owners and marketers, the opportunity is simple: you already have valuable signals (website behavior, sales activity, customer questions, reviews, and social conversations). Big data helps you turn those signals into actions that improve revenue, retention, and efficiency.
This guide explains what big data means in a practical sense, how businesses use it, the benefits you can apply right away, and a step-by-step plan to get started without building a complicated tech stack.
What “Big Data” Actually Means (In Plain English)
Big data usually shows up when information is:
- Large in volume: lots of records (orders, clicks, tickets, logs)
- Fast in velocity: data changes quickly (real-time browsing, inventory, ad performance)
- Varied in variety: structured + unstructured (spreadsheets + text reviews + call notes)
In practice, big data is less about size and more about bringing multiple sources together so you can see the full customer and business picture.
Big Data vs. Data Analytics vs. Business Intelligence
These terms overlap, but they’re not identical:
- Data analytics: the process of analyzing data to answer questions and guide decisions.
- Business intelligence (BI): reporting and dashboards that help teams track performance (KPIs, trends).
- Big data: datasets or data environments that are too large, too fast, or too messy for simple tools alone—so you need smarter storage, integration, or processing.
If you’re early on, don’t worry about labels. Focus on outcomes: better decisions and measurable improvements.
Why Big Data Matters for Modern Businesses
Every customer interaction leaves a trail: browsing patterns, purchase history, email engagement, customer service conversations, product usage, and more. When you connect those signals, you can:
- Understand what different customer groups value (and what turns them off)
- Spot operational problems earlier (before they become expensive)
- Identify emerging demand (so you create and promote the right offers)
- Reduce waste in marketing spend (by targeting the right people with the right message)
Big data became useful (not just “available”) as tools improved for handling both structured data (databases, transactions) and unstructured data (reviews, chat logs, social posts). Today, even smaller teams can access analytics, automation, and dashboards that used to require enterprise budgets.
Where Your Big Data Comes From (Common Business Data Sources)
You don’t need to “go find data.” Most businesses already have it. Here are common sources by function:
Marketing
- Website analytics (traffic sources, pages, funnels)
- Email engagement (opens, clicks, conversions)
- Paid media performance (ad groups, audiences, creative)
- SEO data (queries, pages, rankings, on-page behavior)
Sales
- CRM records (pipeline stages, win/loss reasons)
- Call notes and meeting outcomes
- Quotes, discounting, and deal cycles
- Repeat purchase and reorder patterns
Customer service and success
- Support tickets and chat transcripts
- CSAT/NPS feedback and comments
- Return reasons and refunds
- Common onboarding or product “sticking points”
Operations
- Inventory, fulfillment, and shipping performance
- Supplier lead times
- Quality-control checks and defects
- Workforce scheduling and productivity signals
Quick win: Pick one business goal and list the 3–5 data sources that most directly influence it. That list becomes your starting stack.
How Businesses Use Big Data (Real-World Use Cases)
Below are the most common applications across industries. Use them as a menu—pick the 1–2 that match your goals right now.
Improved Operations
Operations teams use data to reduce waste, prevent errors, and respond faster. For example, analyzing service-call records can reveal a spike in complaints tied to a specific account type or product issue—so teams can investigate root causes before the problem spreads.
Retail teams also use near-real-time sales data to decide what to restock and when. The result is fewer stockouts, less over-ordering, and better freshness for time-sensitive products.
Operational playbook
- Data needed: sales by SKU, stock levels, returns/defects, fulfillment times
- What to measure: stockout rate, on-time delivery, return rate, cost per shipment
- First test: adjust reorder points for your top 20 products and track stockouts vs waste
Better Customer Service
Support data shows where customers get stuck and what answers actually help. When you connect tickets with purchase history and product usage, you can:
- Prioritize fixes that reduce repeated tickets
- Route urgent or complex cases faster
- Create self-service content based on real questions (not guesses)
Support playbook
- Data needed: ticket tags, response times, resolution outcomes, refunds/returns
- What to measure: time to first response, time to resolution, repeat ticket rate
- First test: build a “Top 20 Issues” report, then update one help article and measure ticket drop
Personalized Experiences (Without Being Creepy)
Recommendation engines are a visible example of data-driven personalization. When done well, personalization feels helpful: it removes friction, reduces decision fatigue, and highlights relevant options.
Common personalization areas:
- Product or content recommendations
- Email timing and offers
- On-site messaging by intent (new vs returning visitors)
- Checkout nudges (e.g., shipping updates, size guides, trust badges)
Personalization playbook
- Data needed: browsing history, past orders, email engagement, on-site searches
- What to measure: conversion rate, AOV, bounce rate, repeat purchase rate
- First test: show “recently viewed” items for returning visitors and track conversion lift
Track Behavior (Ethically)
Most websites and apps measure how people move through pages, where they drop off, and what they click. That behavioral data can improve UX and conversion rates—but it must be handled responsibly.
Practical guardrails
- Collect only what you need for a defined decision
- Be transparent with cookie/consent notices
- Secure customer data with access controls and retention policies
- Avoid collecting sensitive data unless you truly need it and can protect it
Identify Trends
Search patterns, social mentions, and sales signals can reveal rising demand. Trend detection helps teams adjust:
- Content topics and SEO priorities
- Product assortments and pricing
- Promotions and seasonal messaging
Trend playbook
- Data needed: search queries (site + Google), social mentions, category sales trends
- What to measure: query growth, mention volume, category revenue share
- First test: build a monthly trend report and create content/pages for the top emerging themes
Predict (and Plan for) Customer Demand
Predictive analytics uses past behavior to estimate what might happen next—like demand for a product category, churn risk, or expected repeat purchases.
You don’t need advanced machine learning to start. Even basic forecasting (seasonality + recent trends) can improve planning.
Simple demand forecast method
- Pull weekly sales for the last 12–26 weeks
- Note seasonal events (holidays, promotions, product launches)
- Compare recent 4-week average vs earlier baseline
- Plan inventory and campaigns around the direction of change
Examples by Industry (To Spark Ideas)
- Ecommerce: optimize product pages using on-site search terms, reduce returns by improving sizing/fit guidance, and personalize bundles by category preference.
- B2B services: analyze lead sources + sales notes to identify which problems convert best, then build SEO content around those high-intent topics.
- SaaS: track feature usage to improve onboarding and reduce churn by sending triggered tips when users stall.
- Local businesses: combine POS data with seasonal patterns to plan staffing and promotions during peak weeks.
The Benefits of Big Data (Practical Plays You Can Run)
Big data is valuable only when it turns into decisions. Here are the most actionable benefits for business growth—plus how to apply each one.
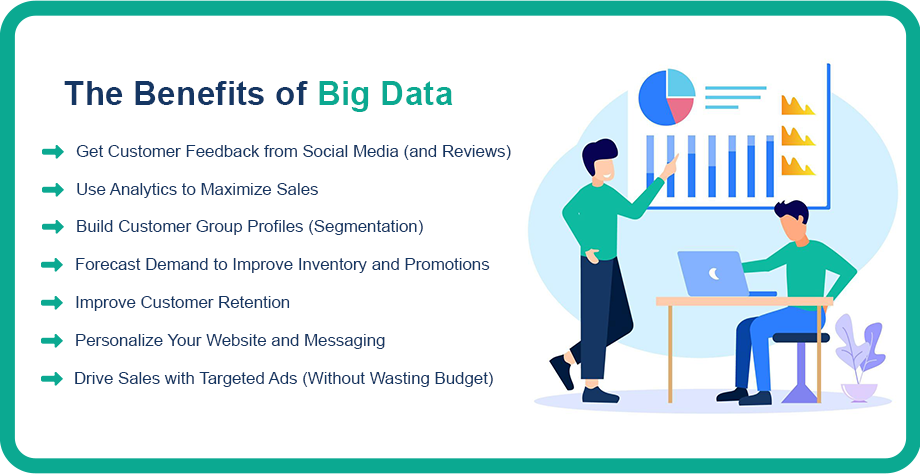
1) Get Customer Feedback from Social Media (and Reviews)
Social posts, reviews, and comments reveal what people love, what annoys them, and what language they use to describe your product. That language is SEO gold—and it improves your messaging and FAQs.
How to use it
- Tag feedback by theme (pricing, shipping, quality, support)
- Track sentiment over time (improving or declining)
- Feed insights into product pages, email copy, and support documentation
Mini template: feedback log
- Source: (review / social / support)
- Theme:
- Customer wording (internal use):
- Impact: (conversion / churn / reputation)
- Action owner + due date:
2) Use Analytics to Maximize Sales
Sales growth often comes from understanding who buys, why they buy, and what stops them. Data sources can include website analytics, email metrics, search queries, campaign performance, and loyalty activity.
What to look for
- Highest-converting channels by customer type
- Pages that assist conversions (and those that leak traffic)
- Offer preferences (discounts vs perks, free shipping, bundles)
- Drop-off points in checkout and lead forms
Mini checklist: funnel questions
- Where are people exiting?
- What information do they need at that step?
- Are you matching the promise in your ads with the page experience?
- Do new vs returning visitors behave differently?
3) Build Customer Group Profiles (Segmentation)
Segmentation helps you avoid one-size-fits-all marketing. Start with simple segments based on behavior:
- New vs returning customers
- High frequency vs occasional buyers
- High AOV vs low AOV
- Category preference (e.g., running shoes vs casual shoes)
Mini template: segment profile
- Segment name:
- Common traits:
- Primary need:
- Common objections:
- Best channels:
- Offer/message angle:
4) Forecast Demand to Improve Inventory and Promotions
Demand forecasting reduces costly decisions—like overstocking slow movers or running out of best sellers.
Easy starting point
- Compare the last 8–12 weeks with the same period last year (if available)
- Note seasonality drivers (holidays, pay cycles, weather-driven demand)
- Plan promotions around what’s trending—not just what’s “on the calendar”
5) Improve Customer Retention
Retention is often more cost-effective than acquisition, but it requires relevance. Big data can support:
- “Win-back” campaigns for dormant customers
- Post-purchase education that reduces returns
- Loyalty perks based on behavior (not just spend)
- Proactive support outreach for high-risk customers
Quick win: build a churn watchlist (e.g., customers who haven’t returned in 60–90 days), then test a simple re-engagement sequence:
- helpful tip + reminder, 2) best sellers, 3) limited-time perk.
6) Personalize Your Website and Messaging
Customer Relationship Management (CRM) tools can bring email, purchase history, and engagement into one place so you can tailor experiences.
Low-effort examples:
- Auto-fill for returning customers
- Recommended add-ons based on last purchase
- Location-based store or shipping options
- Dynamic FAQs based on product category interest
7) Drive Sales with Targeted Ads (Without Wasting Budget)
Data helps you avoid broad targeting. Instead, you can build audiences based on interests and behaviors—then tailor creative and offers to what each group cares about.
Practical approach
- Start with 2–3 core audiences
- Match each audience to one clear promise
- Measure: CTR, CPA, and downstream revenue—not clicks alone
- Refresh creative based on performance by segment
Challenges When Implementing Big Data (and How to Avoid Common Traps)
Big data can create real value, but only if you plan for the messy parts.
Cost and Tool Sprawl
Collecting, storing, and analyzing data can get expensive—especially if you buy tools before defining the decisions you want to improve.
Fix: start with the decision, then work backwards.
- Example decisions: “Which customers are most likely to churn?” “Which products should we promote next month?” “Where do leads drop off?”
Data Quality (Garbage In, Garbage Out)
Duplicates, missing fields, inconsistent naming, and broken tracking can mislead analysis.
Fix: define basic “clean data” rules:
- Standard naming for campaigns and sources
- Required fields for customer profiles
- Monthly audits for tracking errors
- Clear definitions for KPIs (so teams don’t measure different things)
Siloed Data
When marketing, sales, support, and operations don’t share data, you lose the full story. The result is conflicting reports and inconsistent decisions.
Fix: pick one cross-team metric (like repeat purchase rate or refund rate) and build a shared report everyone agrees on.
Skills and Ownership Gaps
Even the best dashboards don’t help if no one owns the insights and actions.
Fix: assign an “insight owner” for each key report:
- Who reviews it?
- How often?
- What decision will it influence?
- What change will be tested next?
Privacy, Security, and Compliance
Data collection must respect privacy expectations and applicable laws and platform rules.
Fix: keep a simple governance checklist:
- What data do we collect, and why?
- Who can access it?
- How long do we keep it?
- How do we protect it (permissions, encryption, backups)?
A Practical Big Data Roadmap (Start Small and Scale)
You don’t need to overhaul everything. Start small and build momentum.
Step 1: Pick one outcome
Choose a goal that matters and is measurable:
- Increase conversion rate on a key page
- Improve repeat purchases
- Reduce support ticket volume
- Reduce stockouts or late shipments
Step 2: Write the decision you want to make
Example: “Which customer segments should we target next month to grow revenue without heavy discounting?”
Step 3: List the data you already have
Most teams can start with:
- Website analytics
- CRM/customer list
- Email platform reports
- Support tickets and reviews
- Sales transactions
Step 4: Choose 5–7 KPIs (not 50)
Here are KPI ideas you can mix and match:
- Marketing: organic traffic, conversion rate, CAC (if available), email revenue share
- Sales: close rate, deal cycle length, repeat purchase rate, AOV
- Support: time to first response, time to resolution, ticket rate per order
- Ops: on-time delivery, stockout rate, return rate, fulfillment cost
Step 5: Build one dashboard (or one weekly report)
Keep it simple. A great first dashboard answers:
- What changed this week?
- Why did it change?
- What are we going to test next?
Step 6: Run one experiment per month
Change one variable at a time and measure impact. Examples:
- Rewrite a product page section based on top objections
- Test one new email segment and offer
- Update a help article and measure ticket reduction
- Adjust reorder points for top products
Step 7: Document learnings and standardize what works
Your “data maturity” grows when insights become repeatable processes—not one-time wins.
A Simple Starter Stack (You May Already Have It)
You can build a strong foundation with lightweight tools:
- Website analytics for traffic and behavior tracking
- A CRM (or customer database) for segmentation and retention
- An email platform for targeted messaging
- A support/helpdesk tool for issues and customer feedback
- A spreadsheet or BI dashboard for weekly reporting
The tool matters less than the habit: review → decide → test → learn.
The Future of Big Data (What to Watch)
As analytics becomes more accessible, the advantage shifts from “who has data” to “who uses it responsibly and consistently.” Expect continued growth in:
- Automated reporting and anomaly detection (spot issues early)
- Better integrations across tools (fewer data silos)
- Stronger expectations around privacy, consent, and transparency
- More first-party data strategies as platforms restrict tracking
The businesses that win will be the ones that combine data with real customer understanding—turning insights into better experiences, smarter operations, and clearer marketing.
Conclusion
Big data can help you grow—but only when it’s tied to decisions, not dashboards. Start with one goal, connect the data you already have, and run small, measurable improvements. Over time, those wins compound into a stronger customer experience and a more resilient business.
Want more practical growth guides?
Explore more articles on XCEEDBD.com about analytics, marketing strategy, and customer insights.
FAQ: Big Data Impact on Businesses
1) Is big data expensive to use?
It can be—especially at scale—but many teams start with tools they already pay for (analytics, CRM, email, support). Focus on high-impact use cases first.
2) What if I don’t have much data yet?
Start with what you can measure today: website traffic, leads, sales, and support questions. Consistent tracking over a few weeks quickly becomes useful data.
3) What are common ways businesses use big data?
Most use it to improve operations, understand customers, personalize marketing, forecast demand, and reduce churn.
4) What’s the difference between data analytics and big data?
Data analytics is the practice of analyzing data to make decisions. “Big data” often involves large, fast, or varied datasets that need more advanced tools to combine and process.
5) How do I know which data to collect?
Collect data that helps you answer a clear business question. If you can’t name the decision it supports, don’t collect it.
6) What’s the biggest mistake companies make with big data?
Buying tools before defining goals. The best approach is goal → questions → data → analysis → action.
7) How can small businesses use big data?
By combining lightweight tools (analytics + CRM + spreadsheets)) with a simple reporting rhythm and a focus on one growth lever at a time.
8) How do I use big data without harming trust?
Be transparent, minimize collection, protect data, and use insights to improve the customer experience—not to manipulate it.
